Key Performance Indicators
This dashboard provides an overview of the key metrics driving our post-market surveillance and complaint handling processes.
Avg. Complaint Closure Time
22 days
Target: < 30 days
Reportable Events (QTD)
4
Previous Quarter: 6
33% Decrease
Overdue Complaints
2
Total Open: 18
Action Required
CAPA Initiation Rate
8%
From confirmed complaints
Stable Trend
Feedback vs. Complaint
6:1
Ratio of feedback entries to complaints
CAPA Effectiveness
95%
CAPAs closed with successful verification
Target: > 90%
KPI Charts Visualized
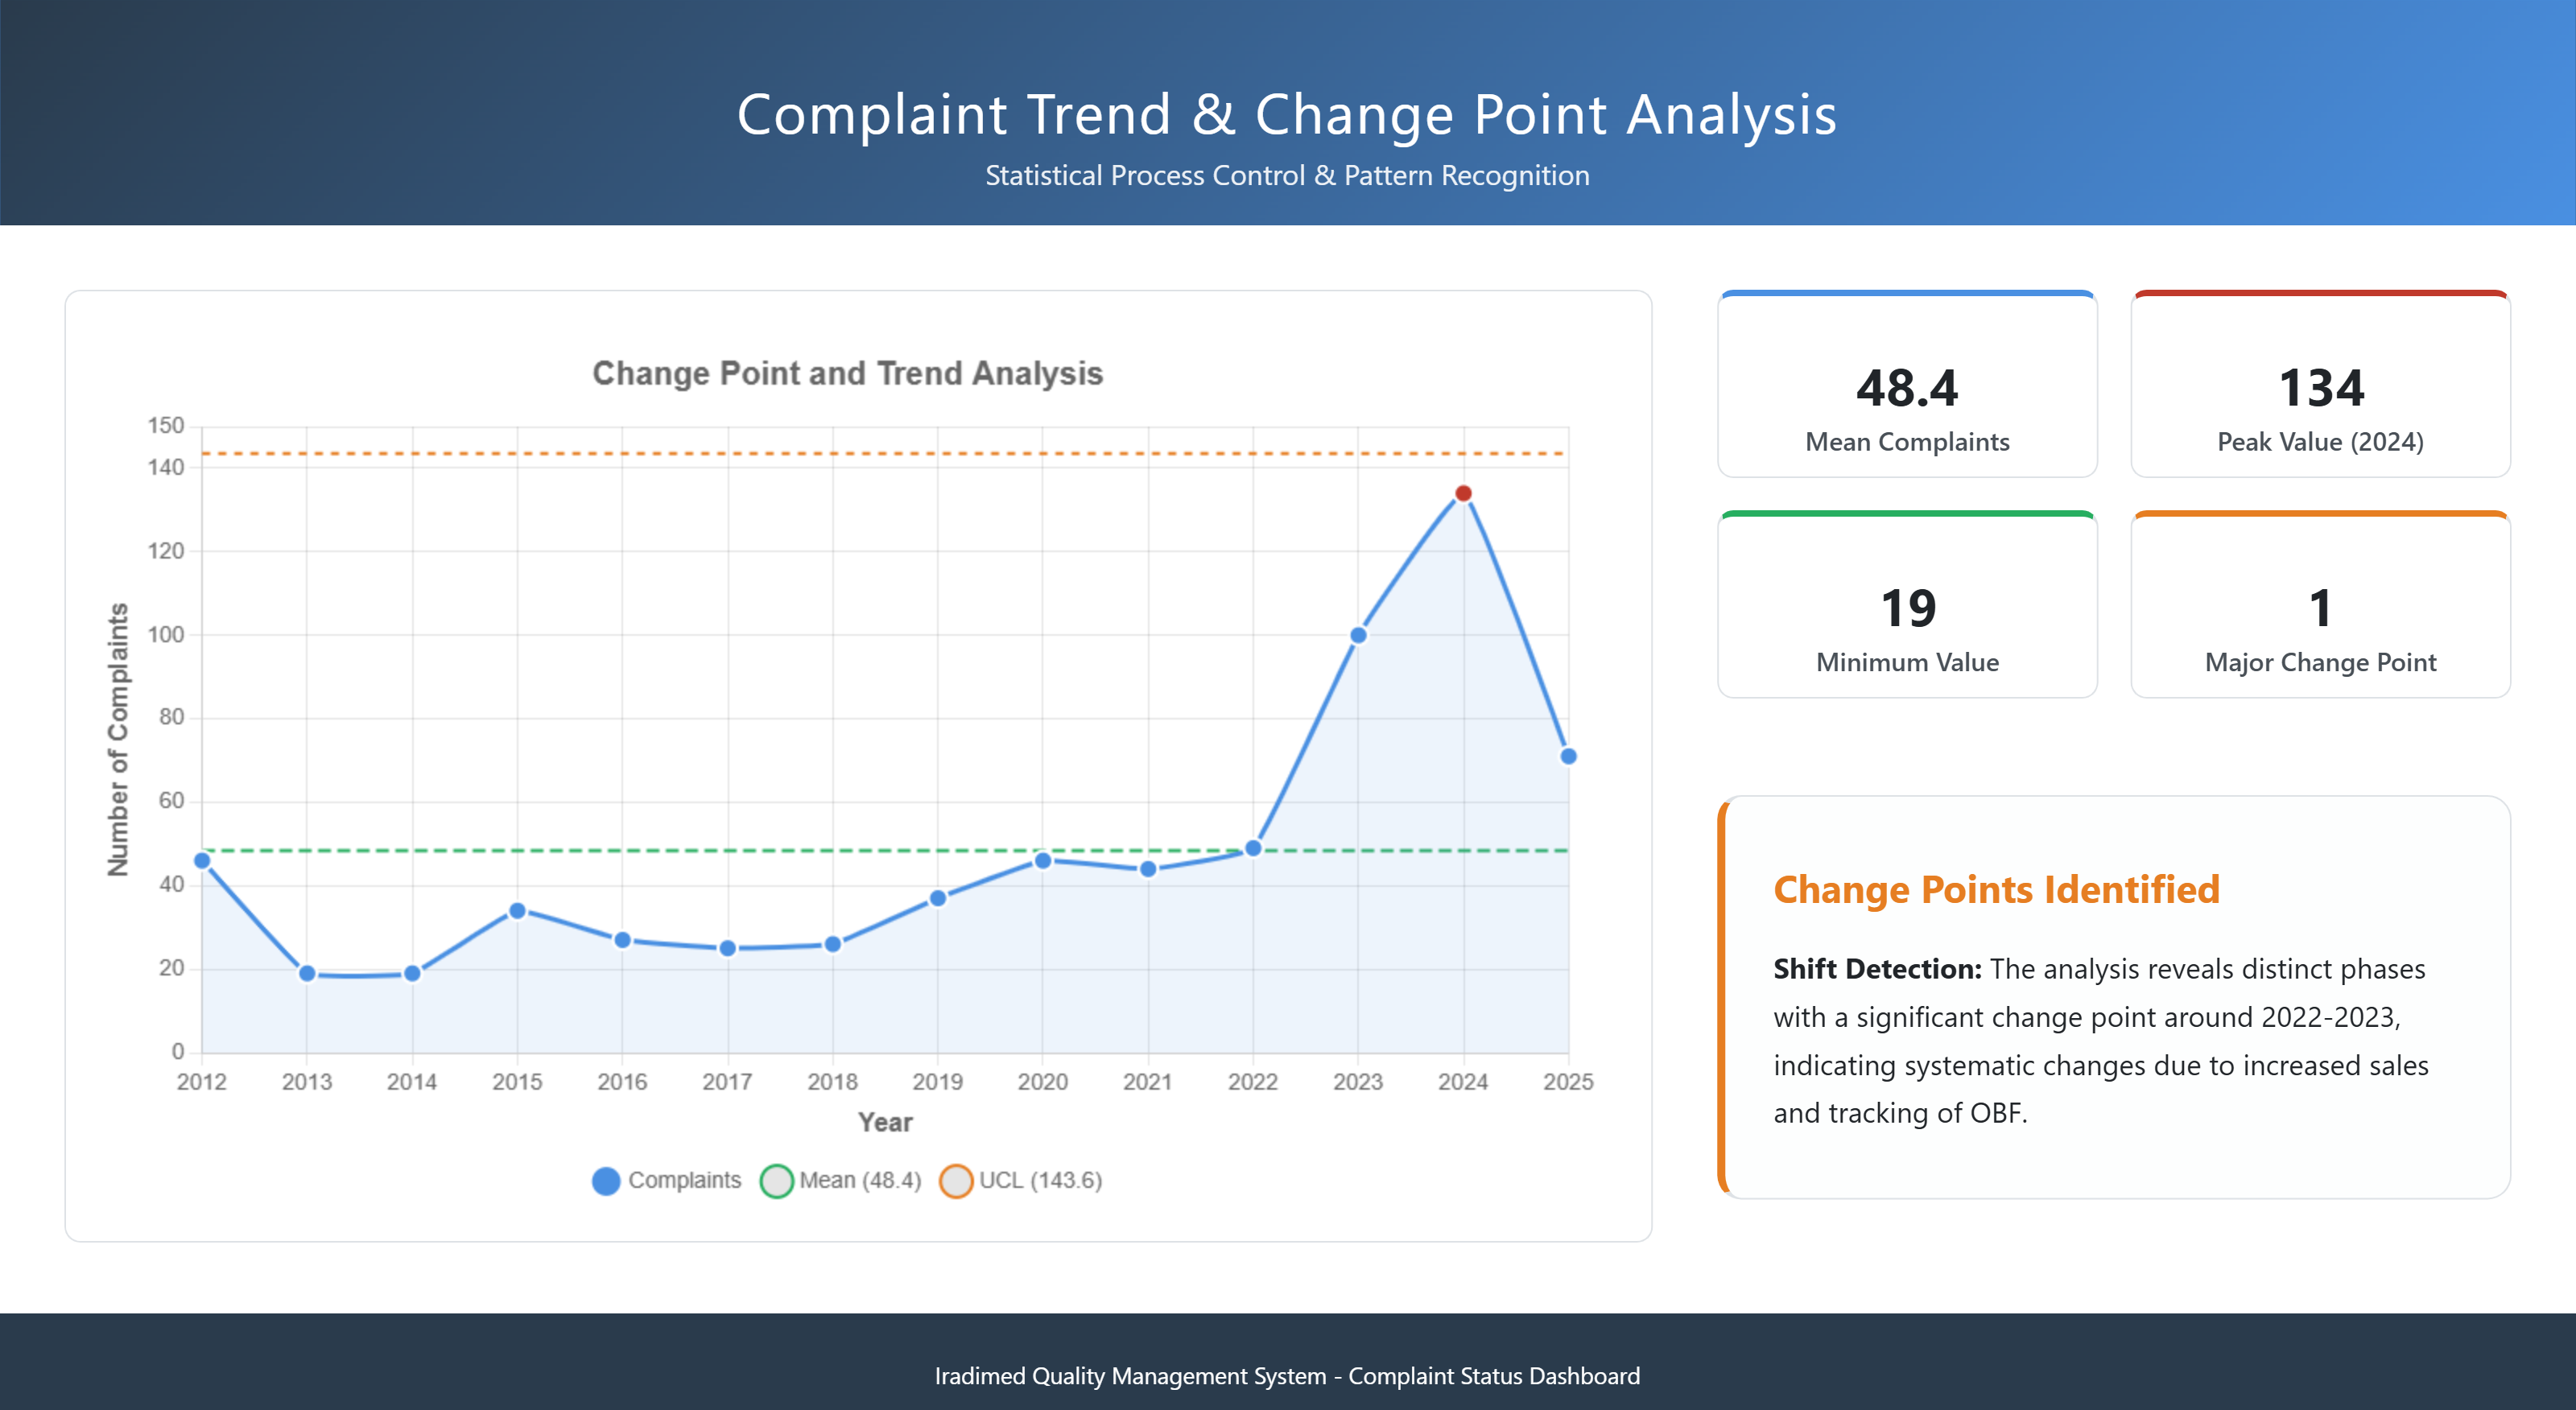
Complaints Over Time
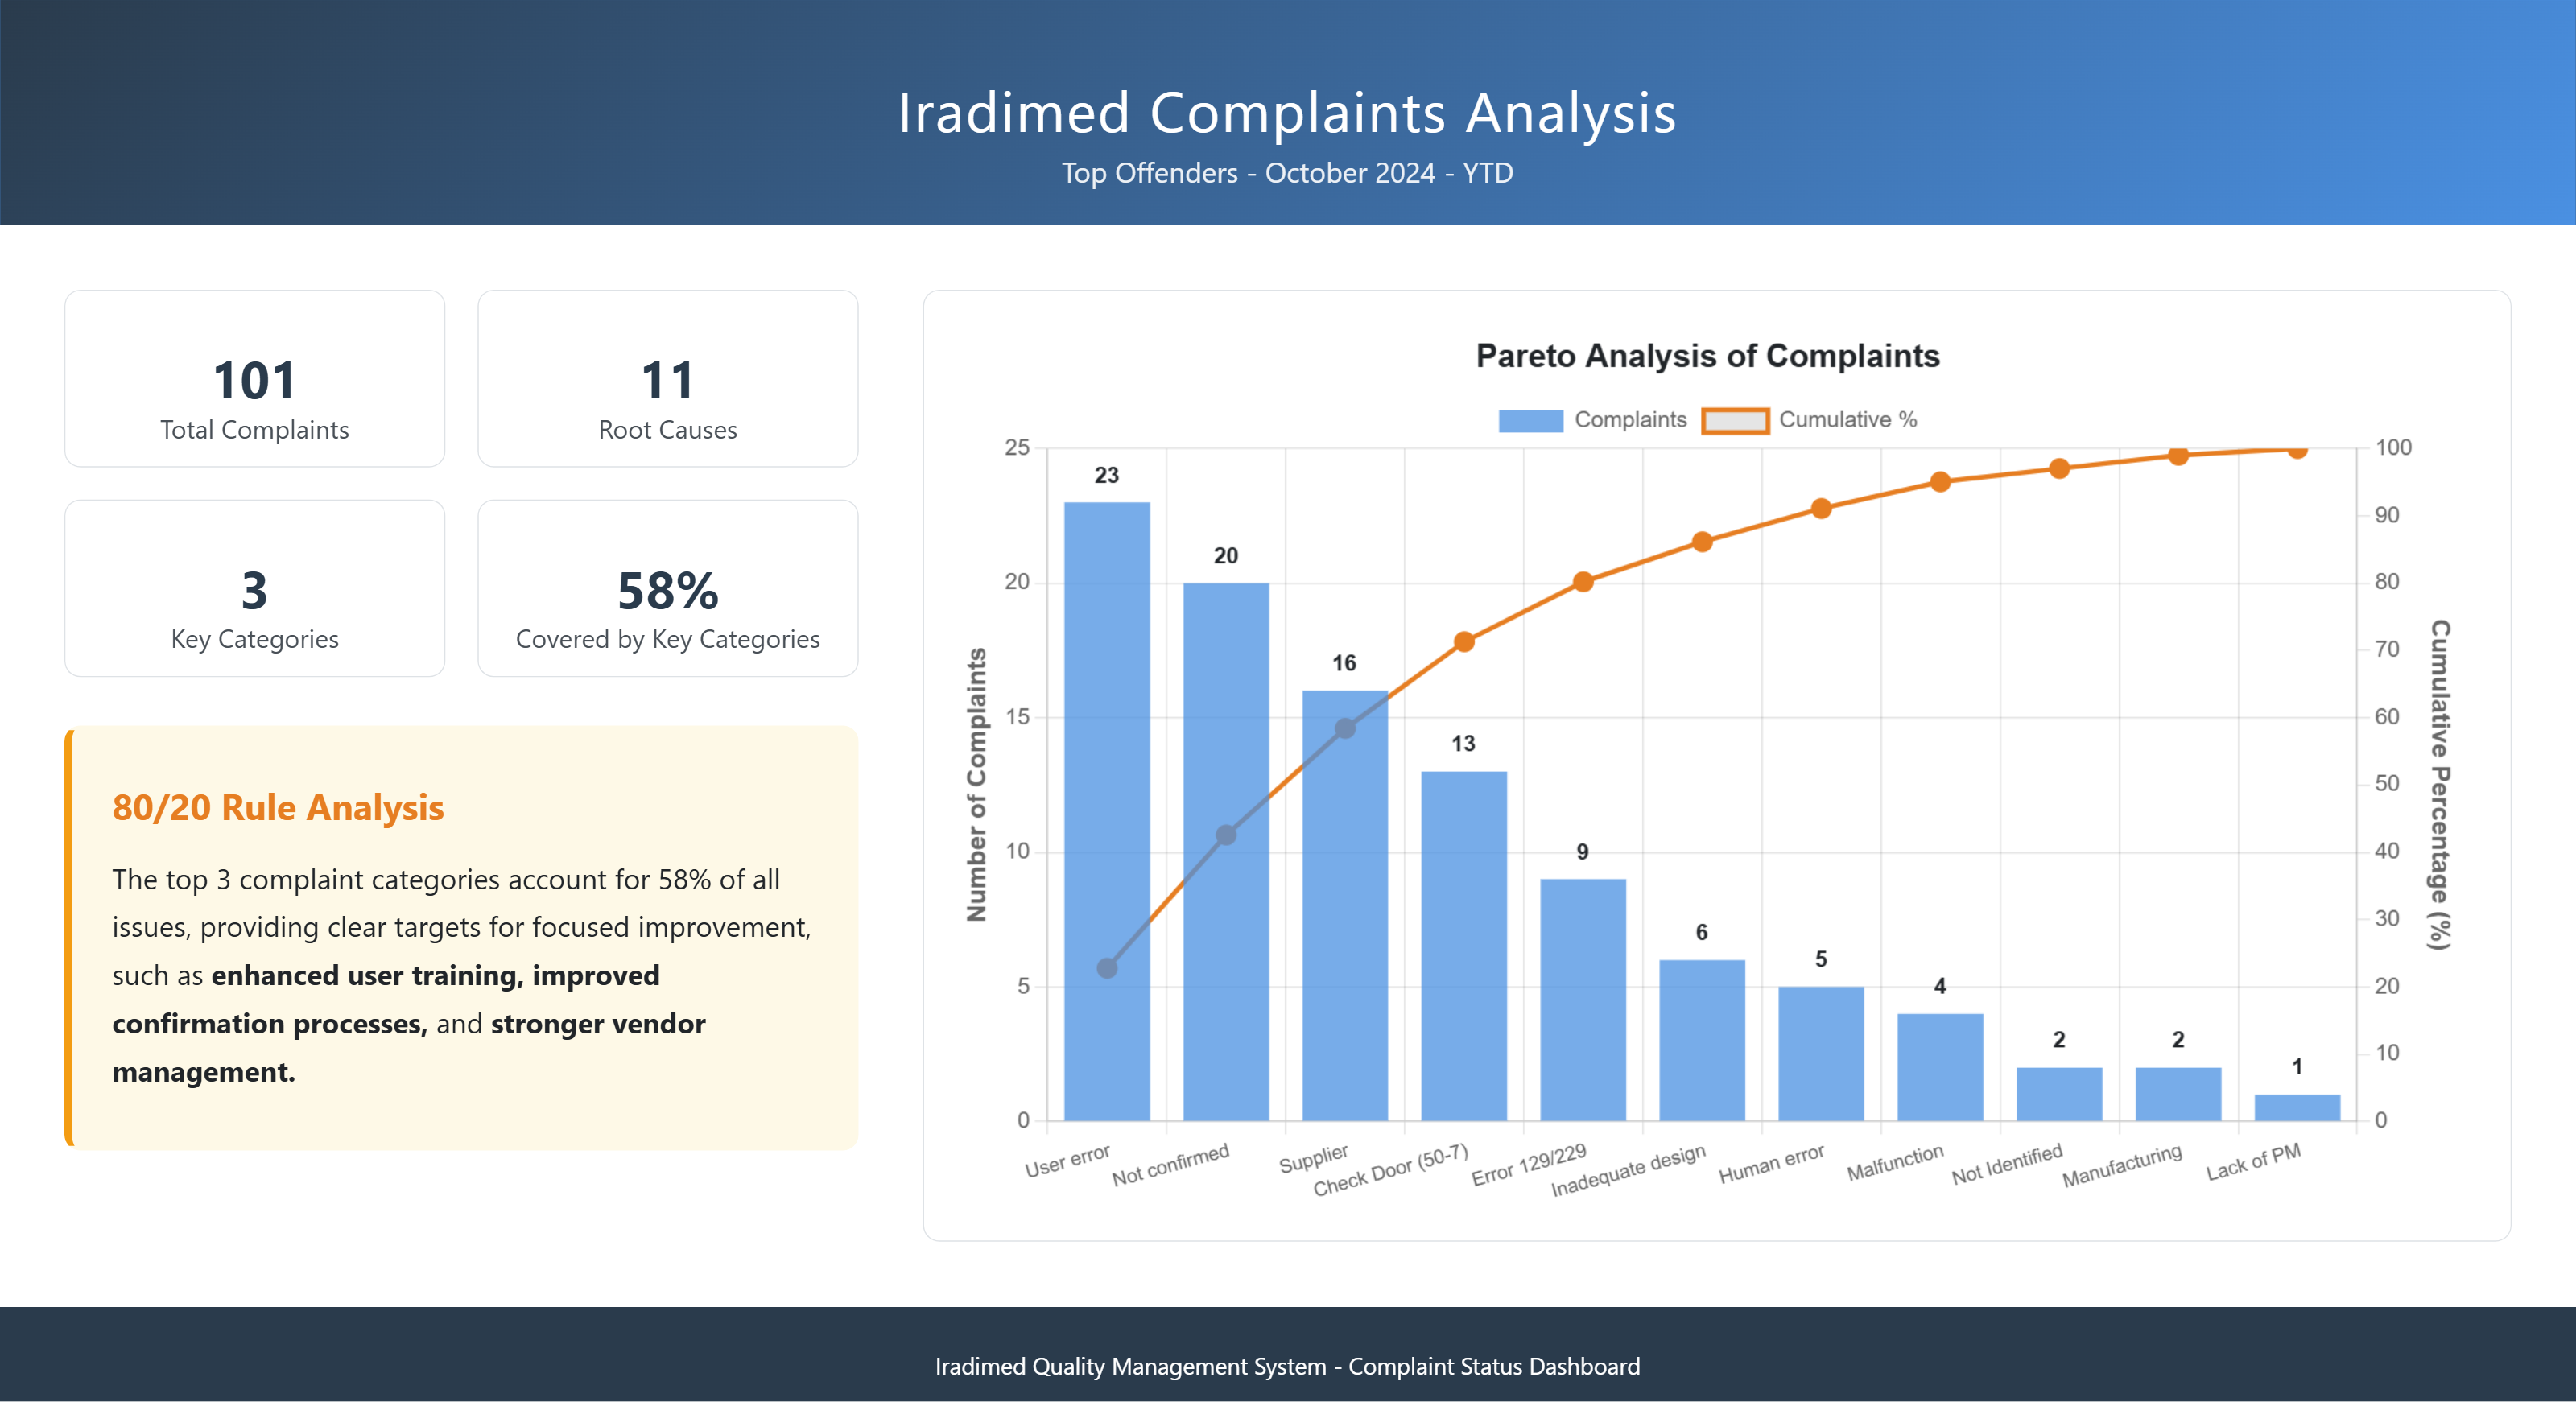
Top Offenders
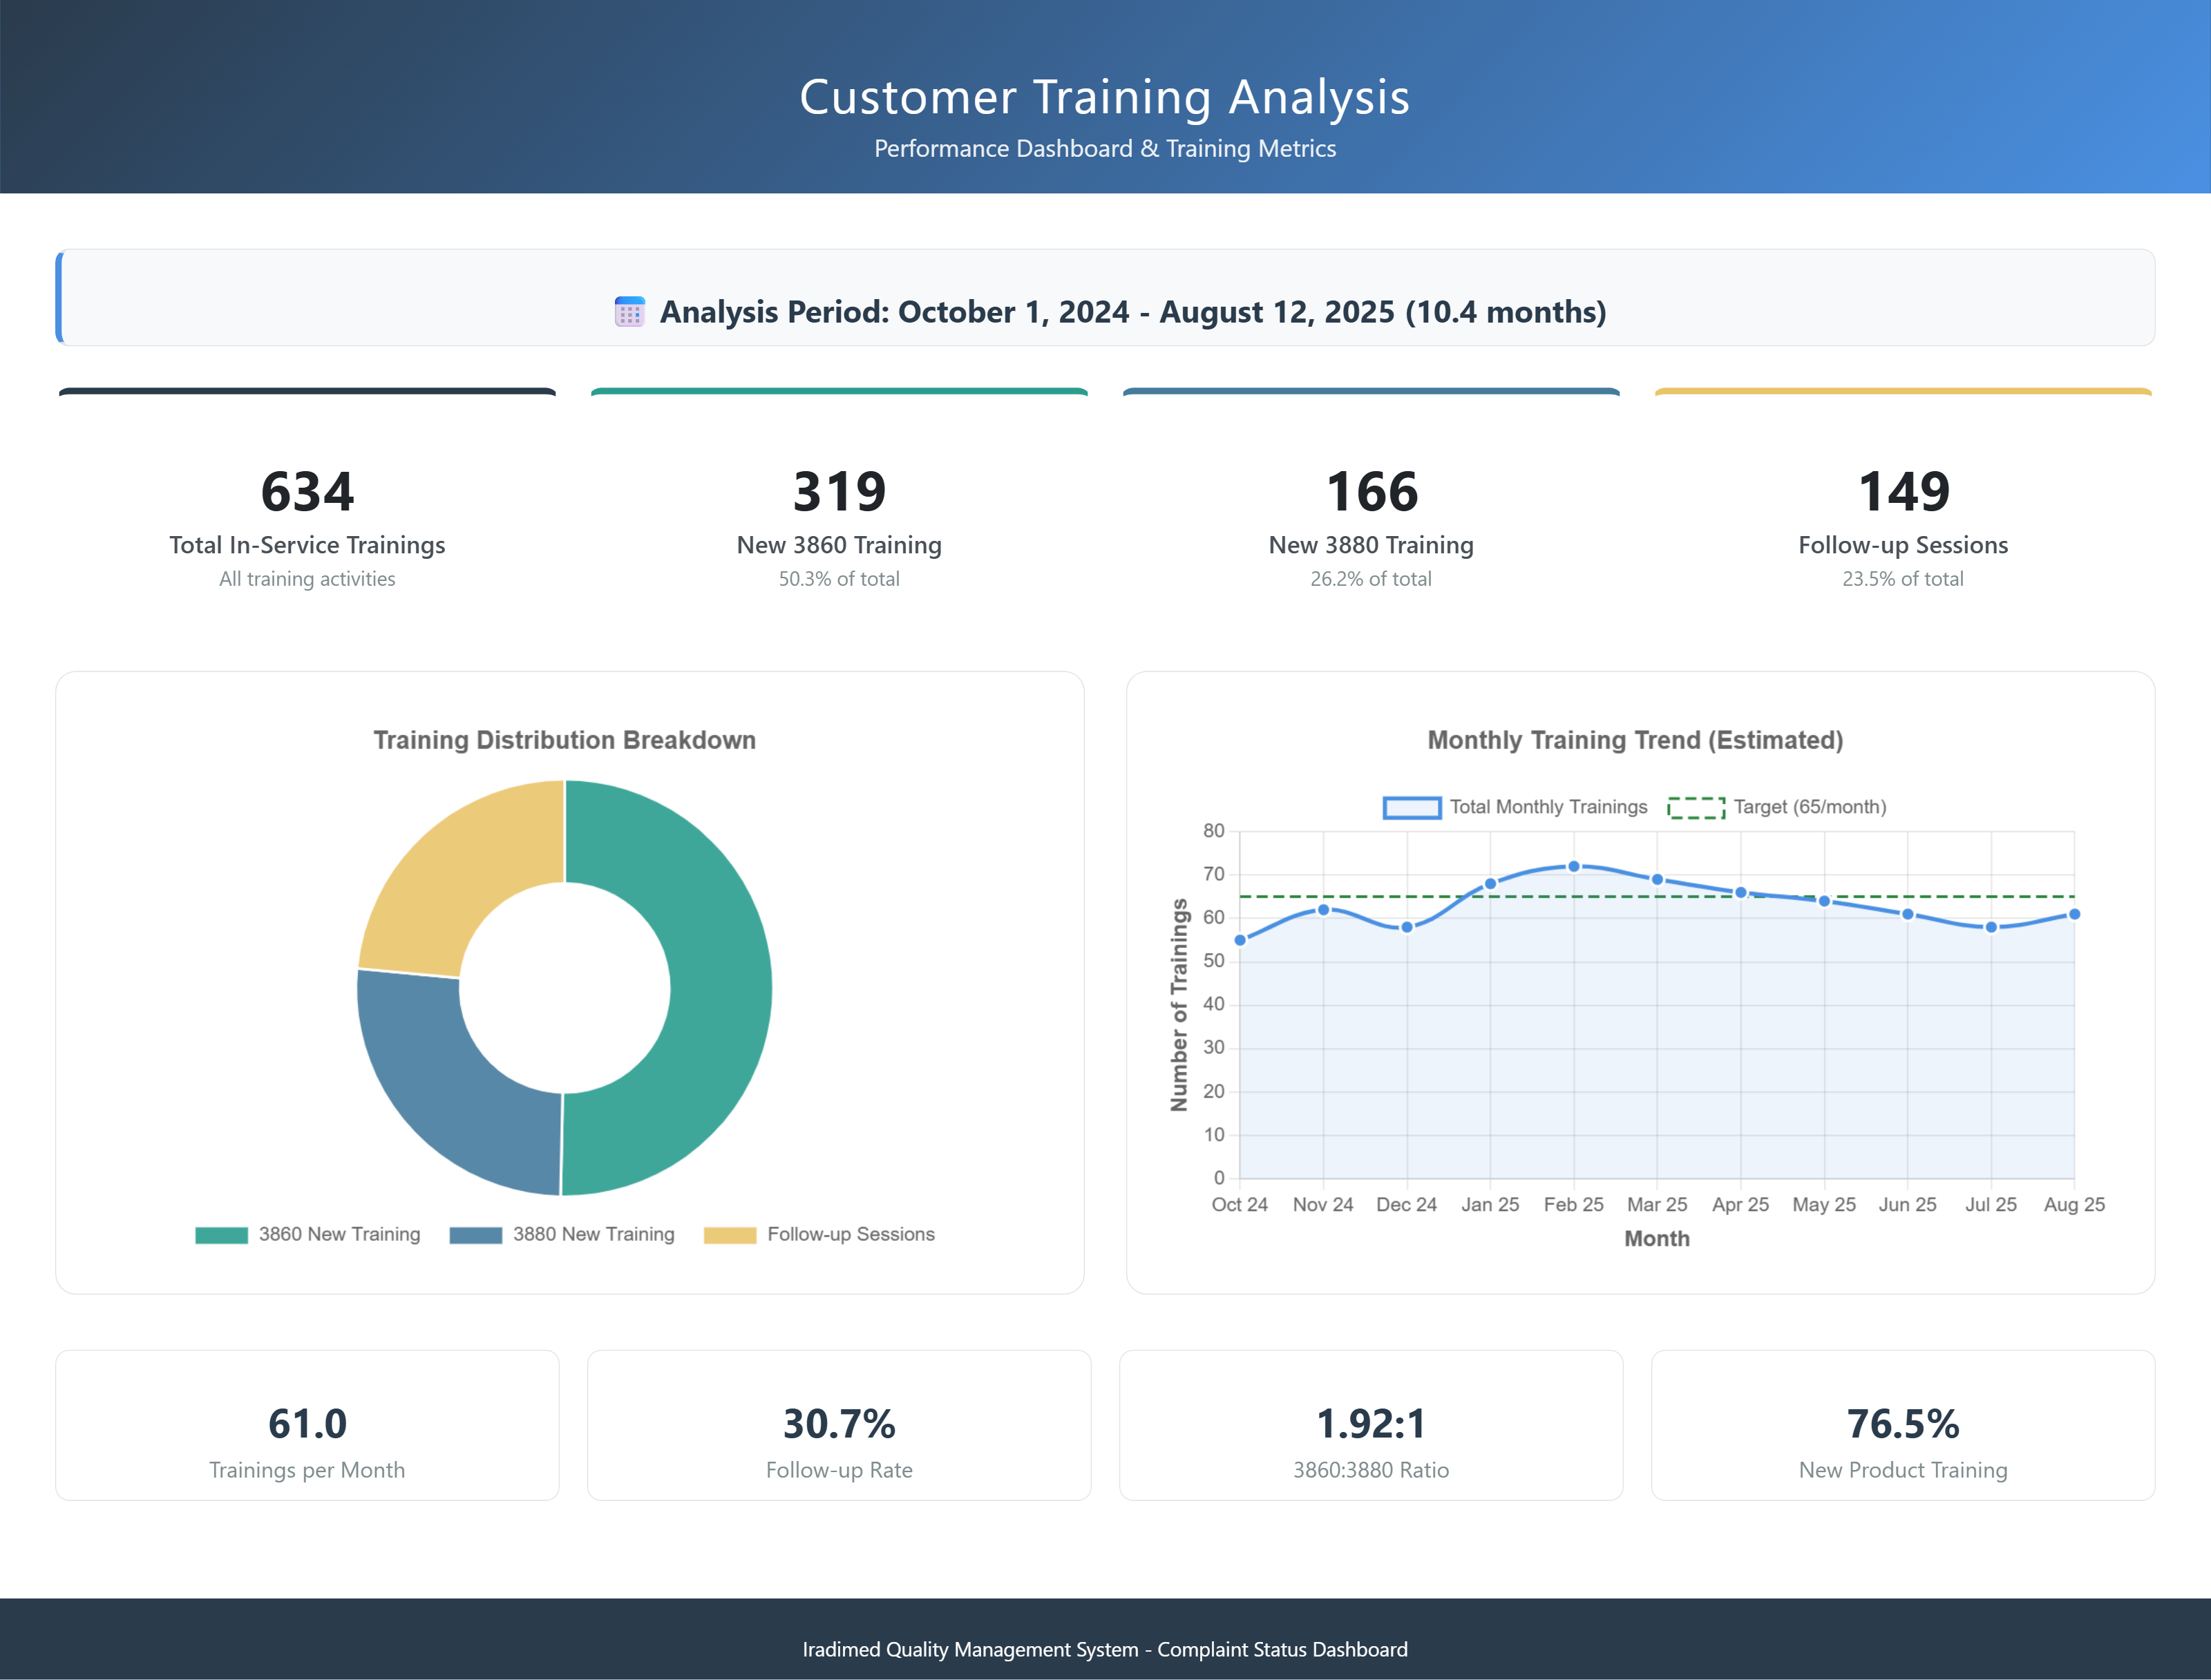
Customer Training
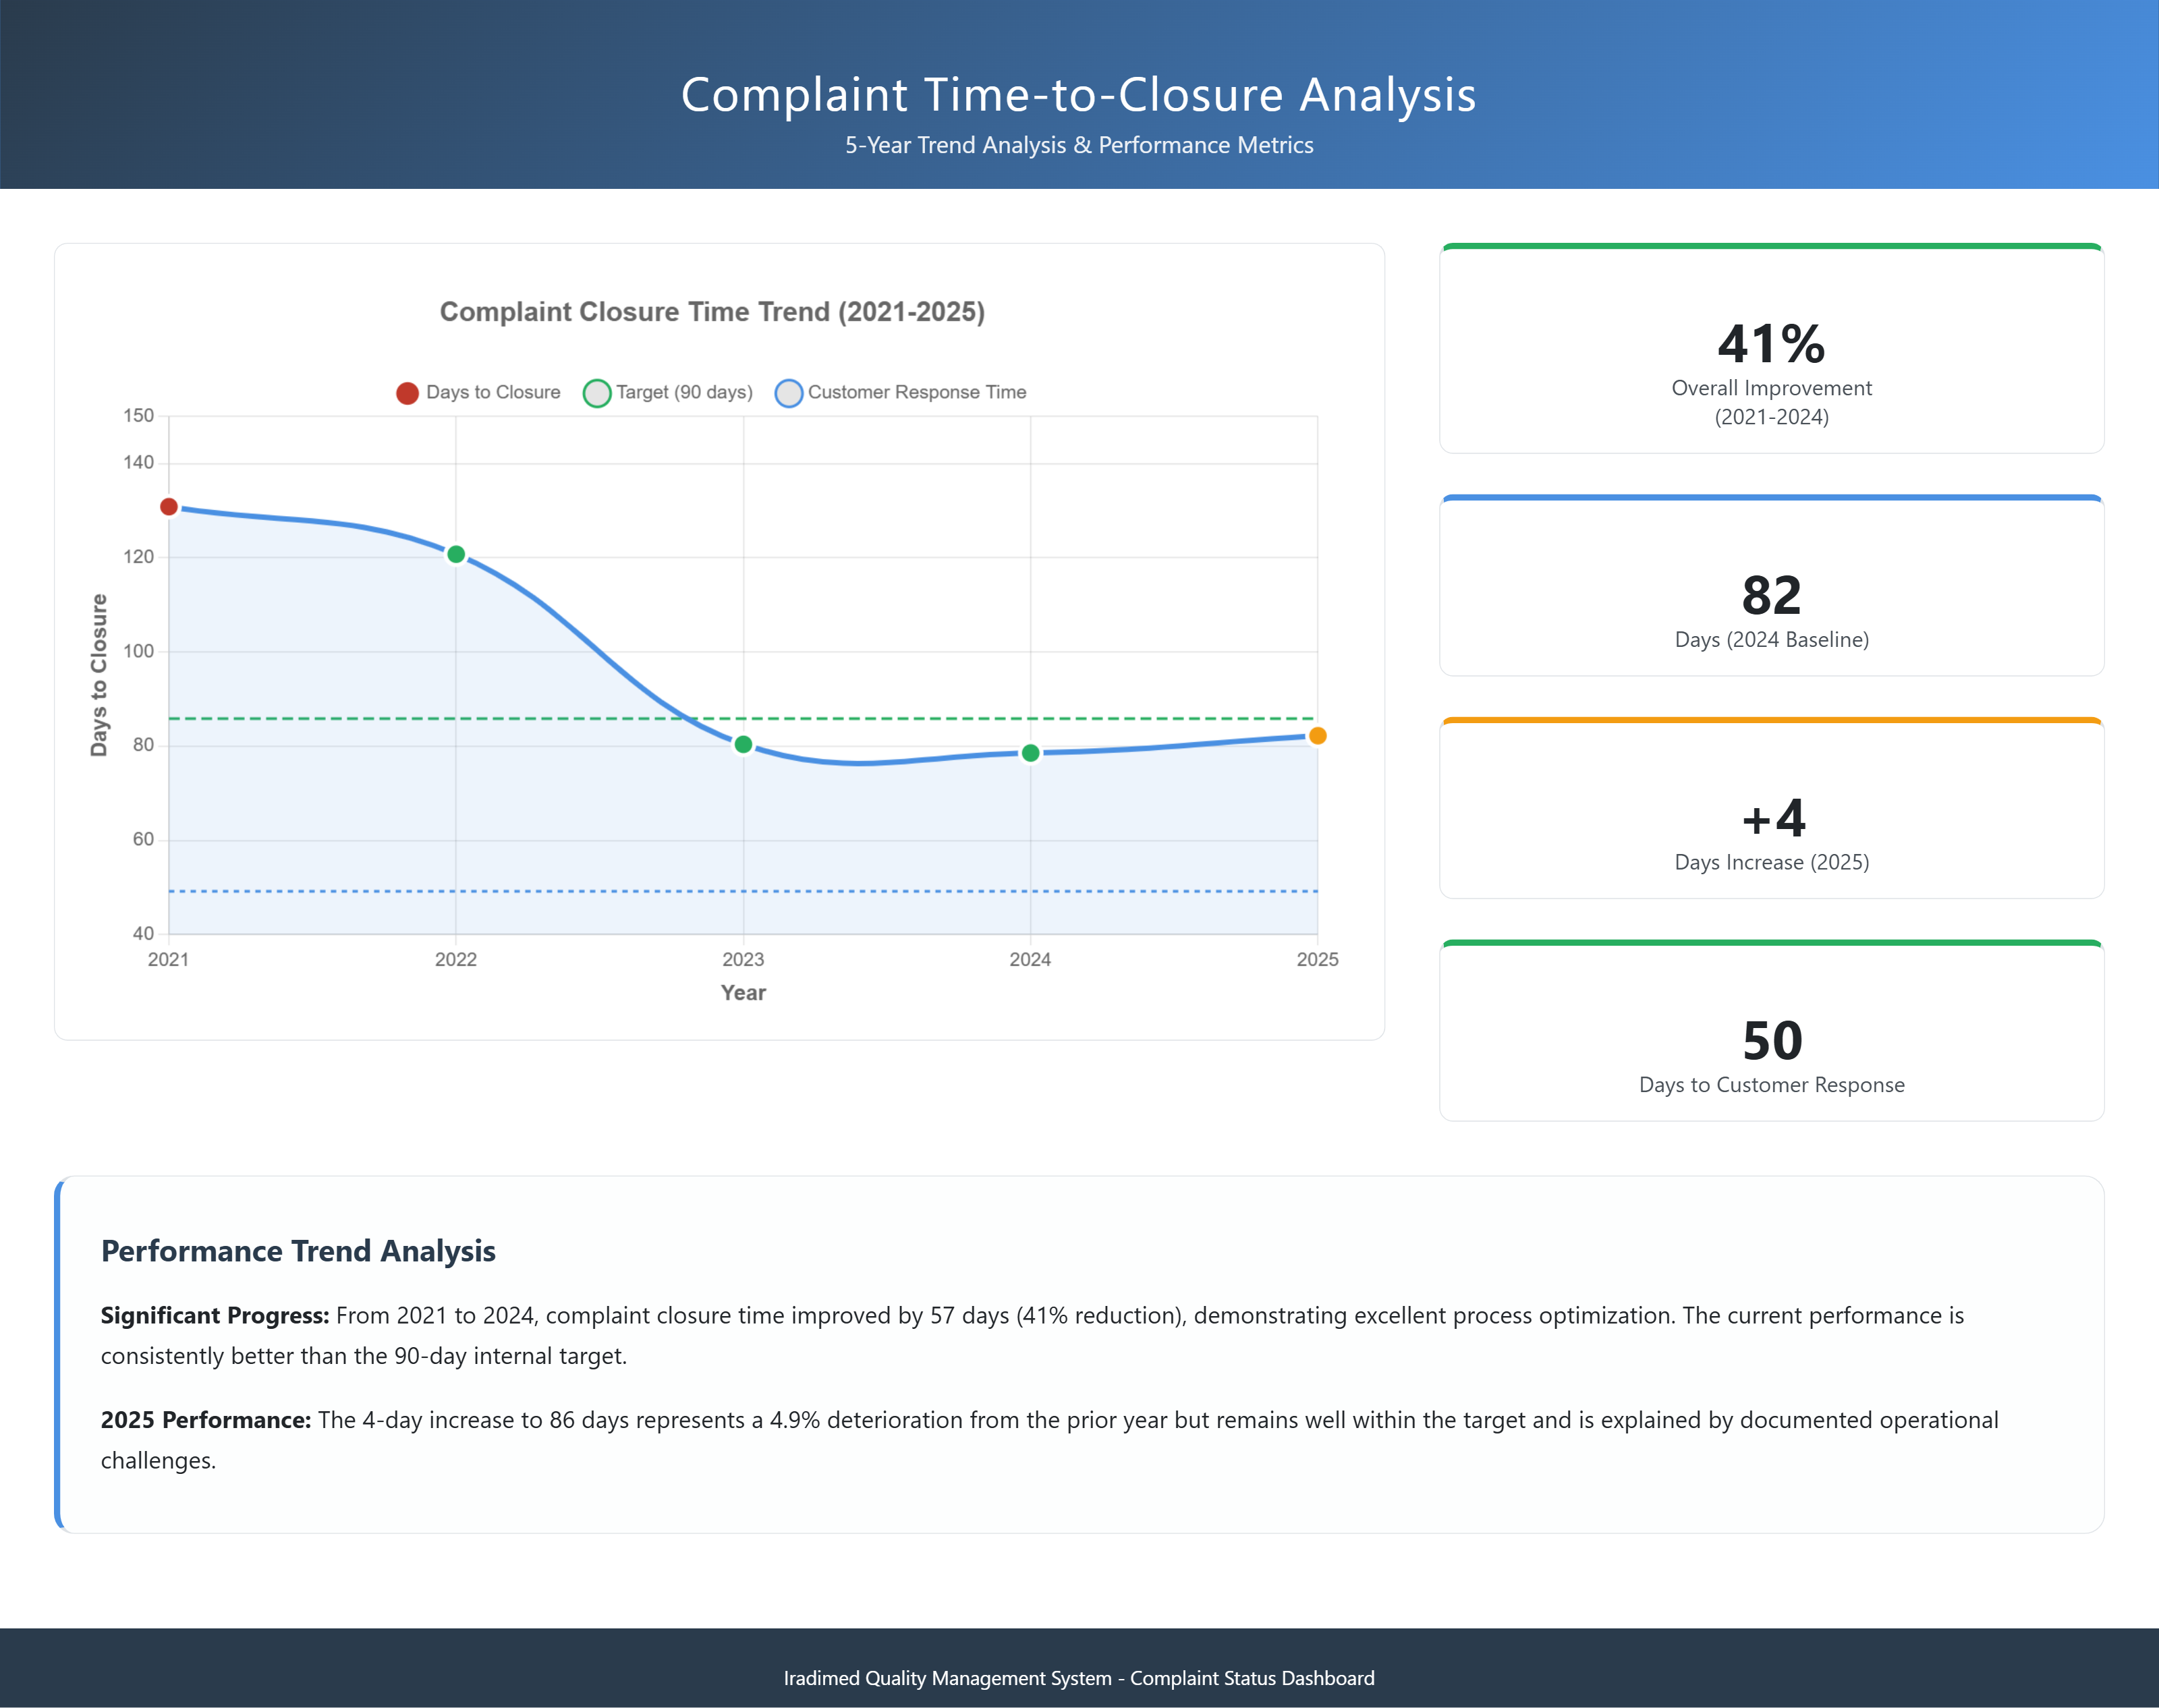
Mean Time to Closure
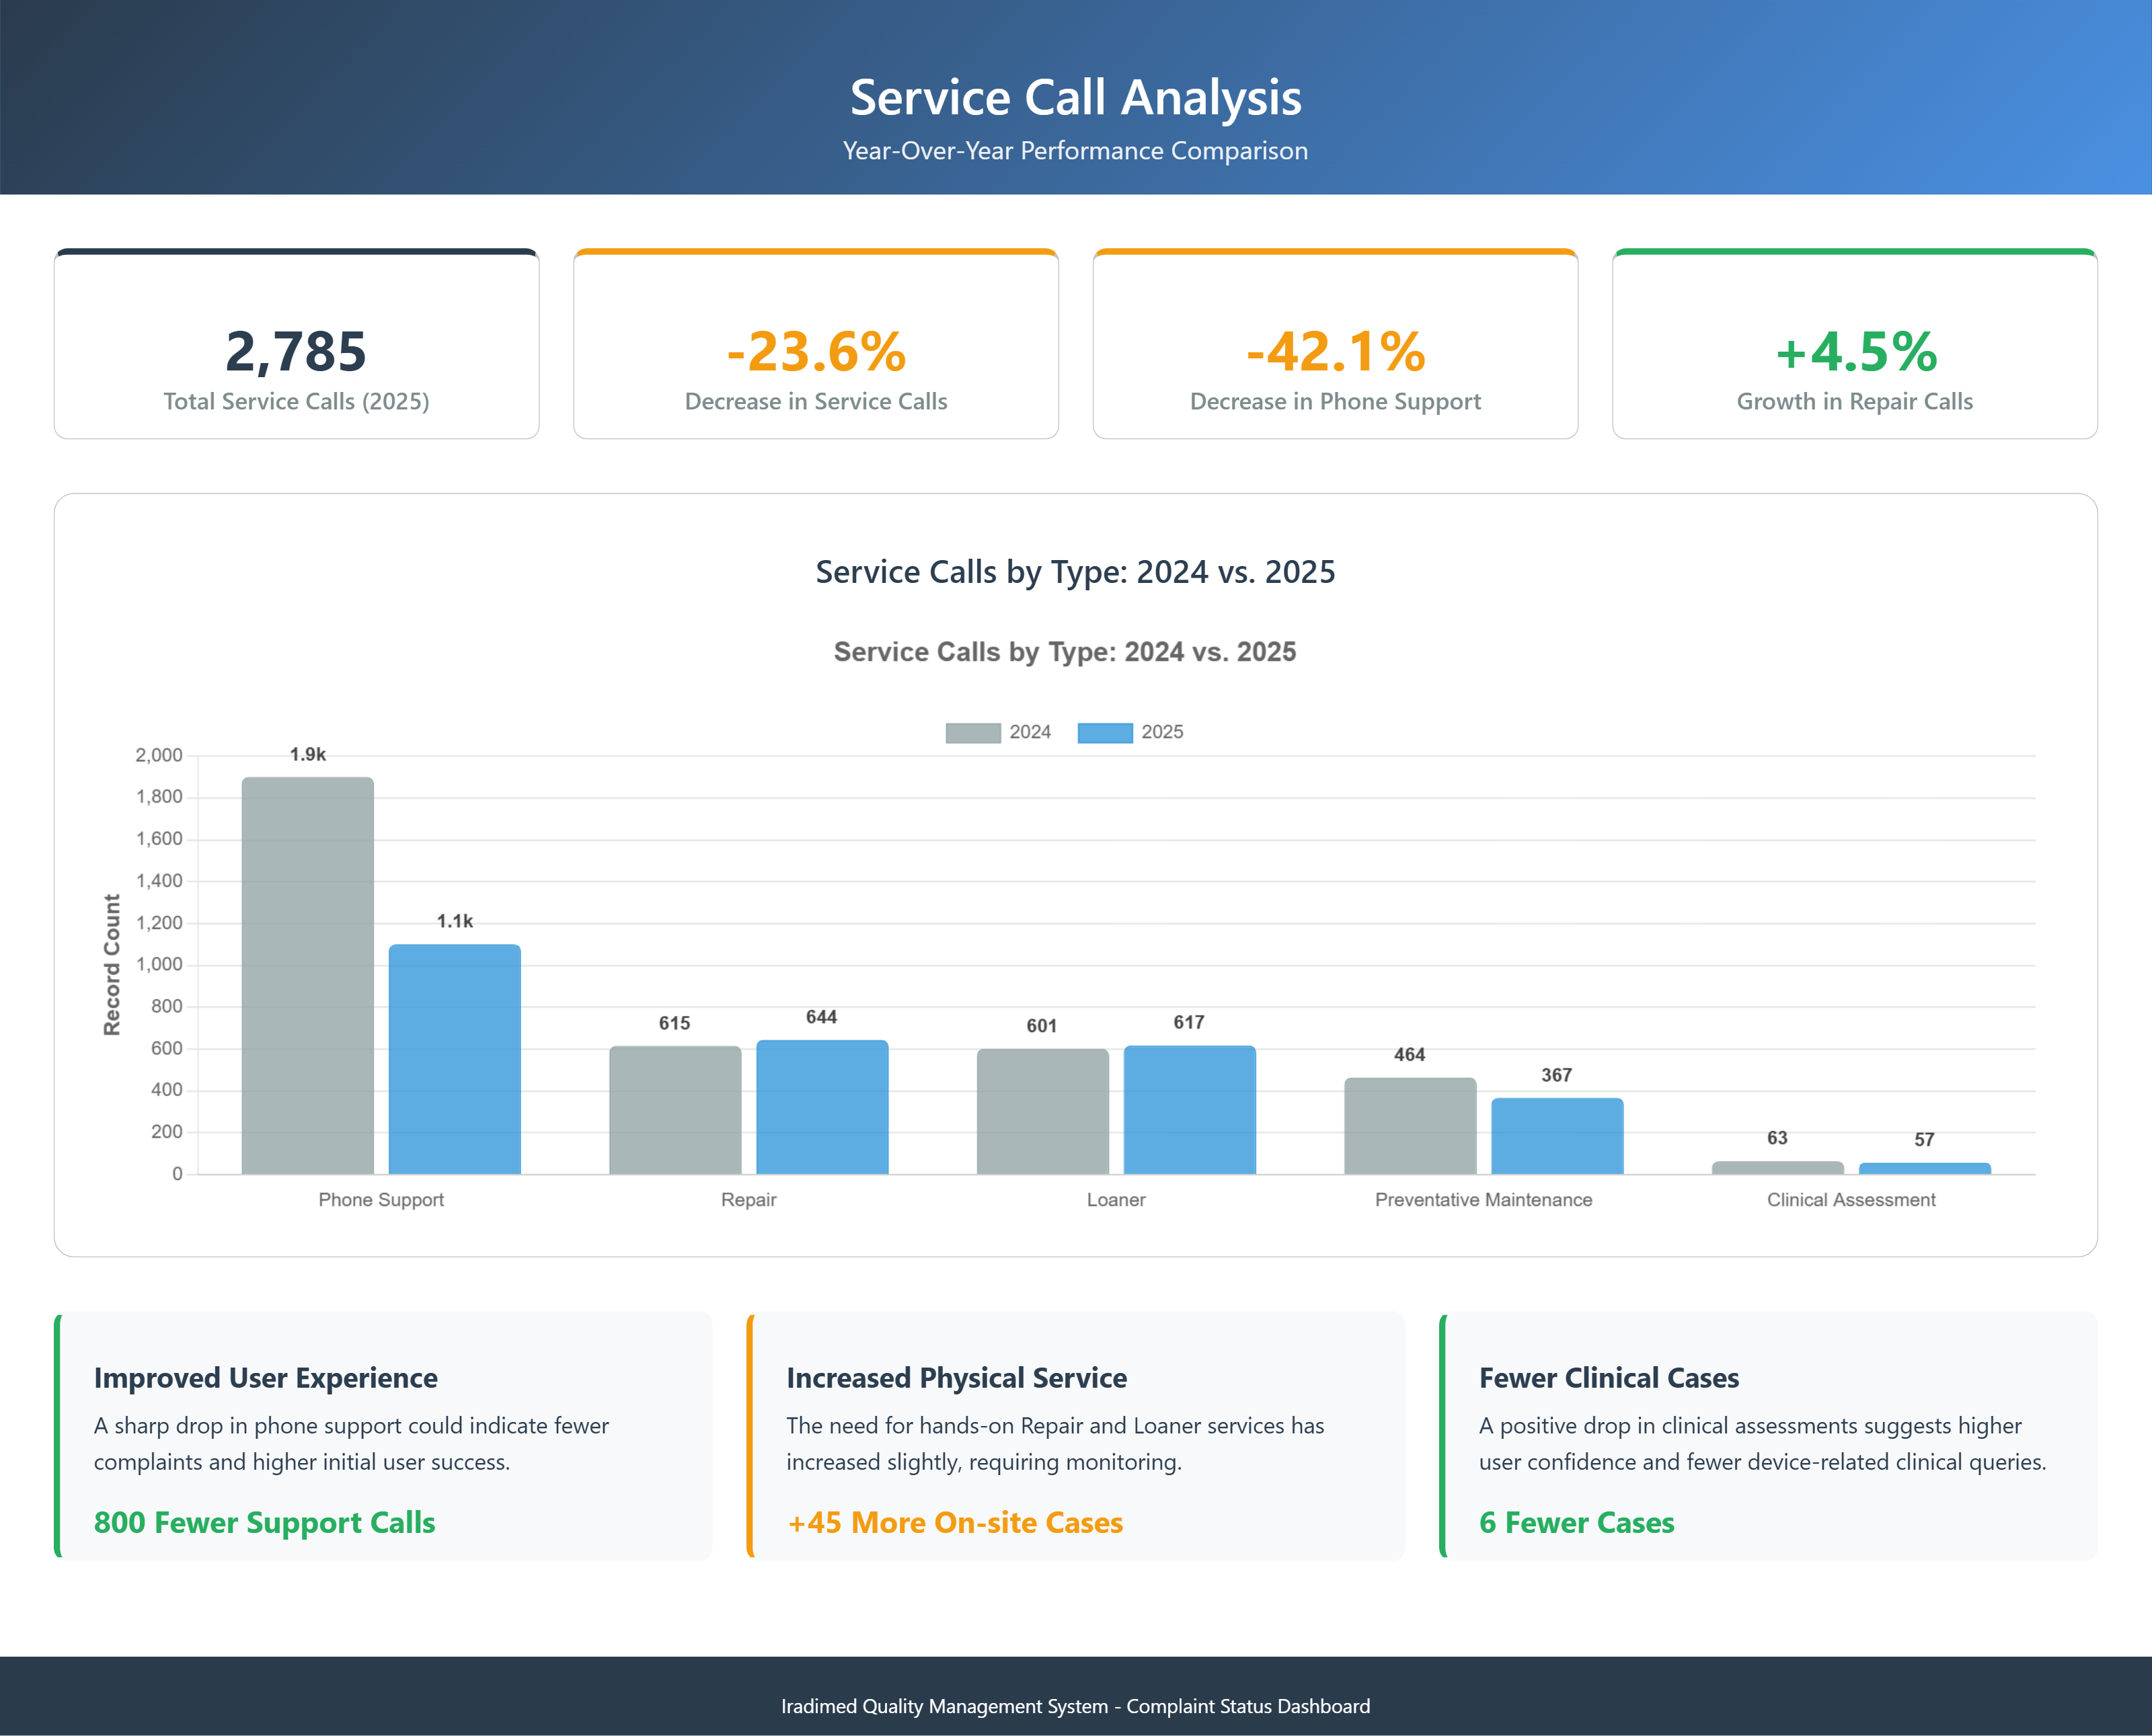
Service Call Analysis
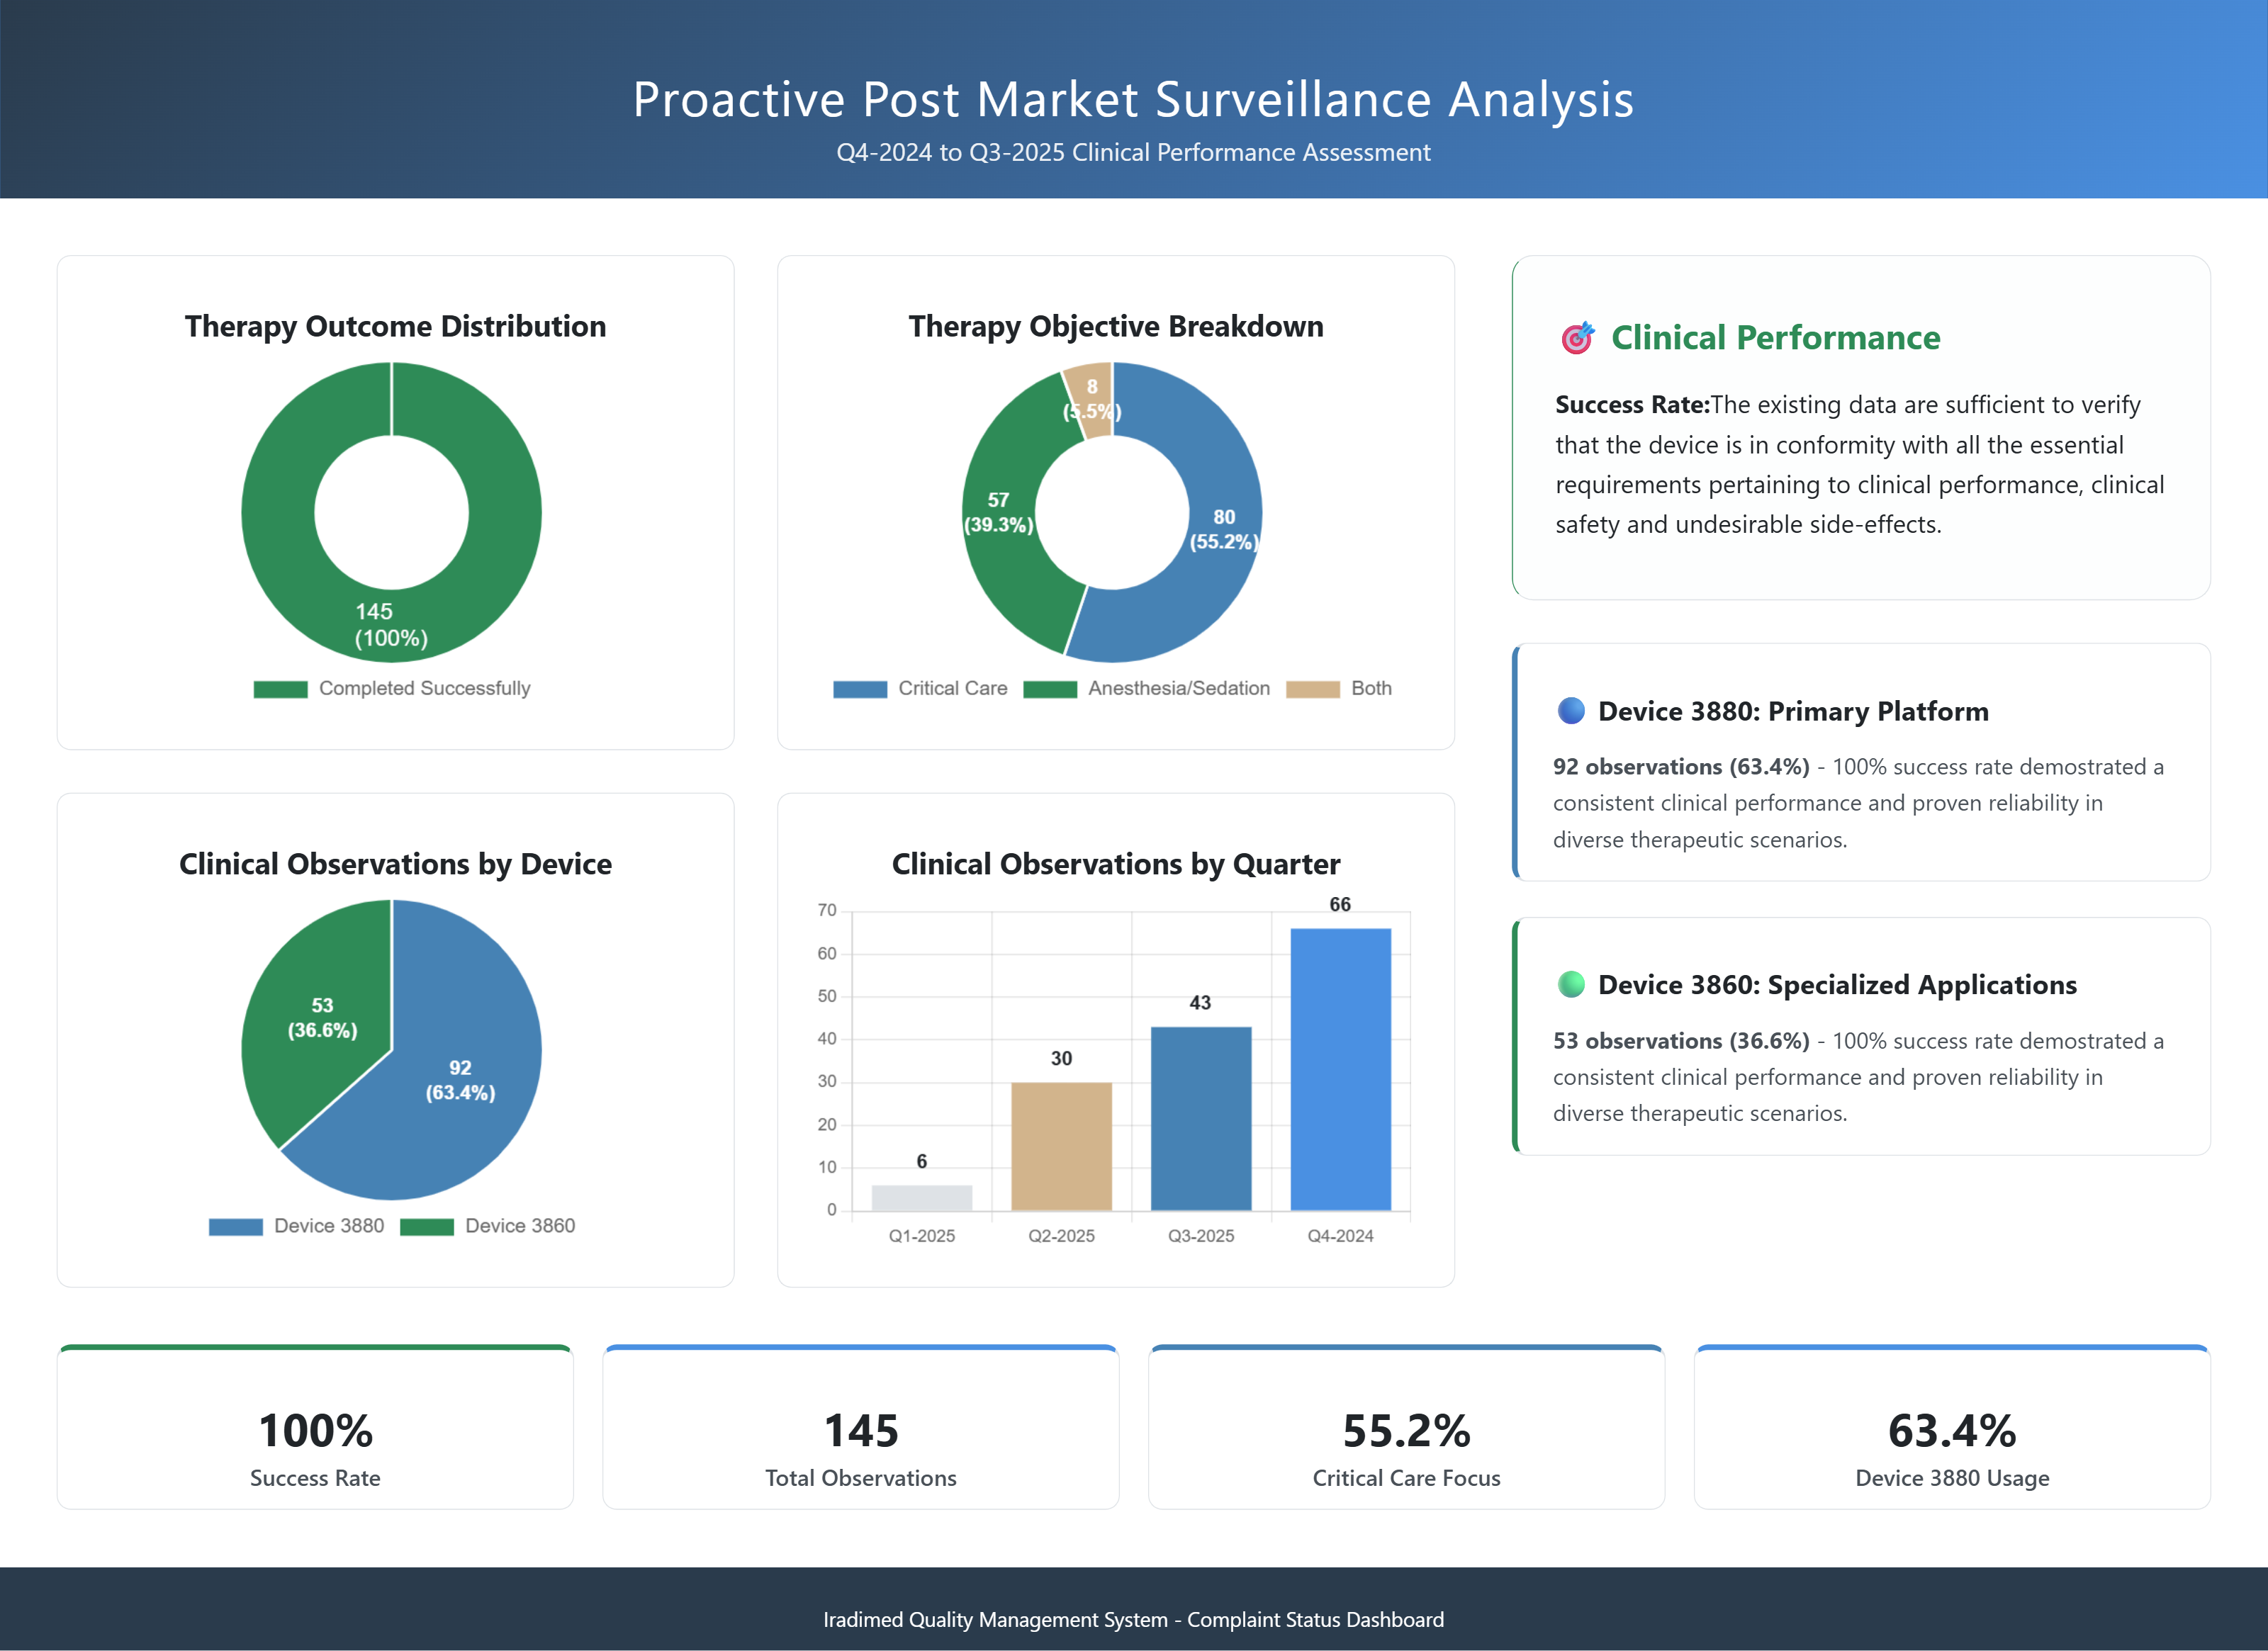
Proactive PMS
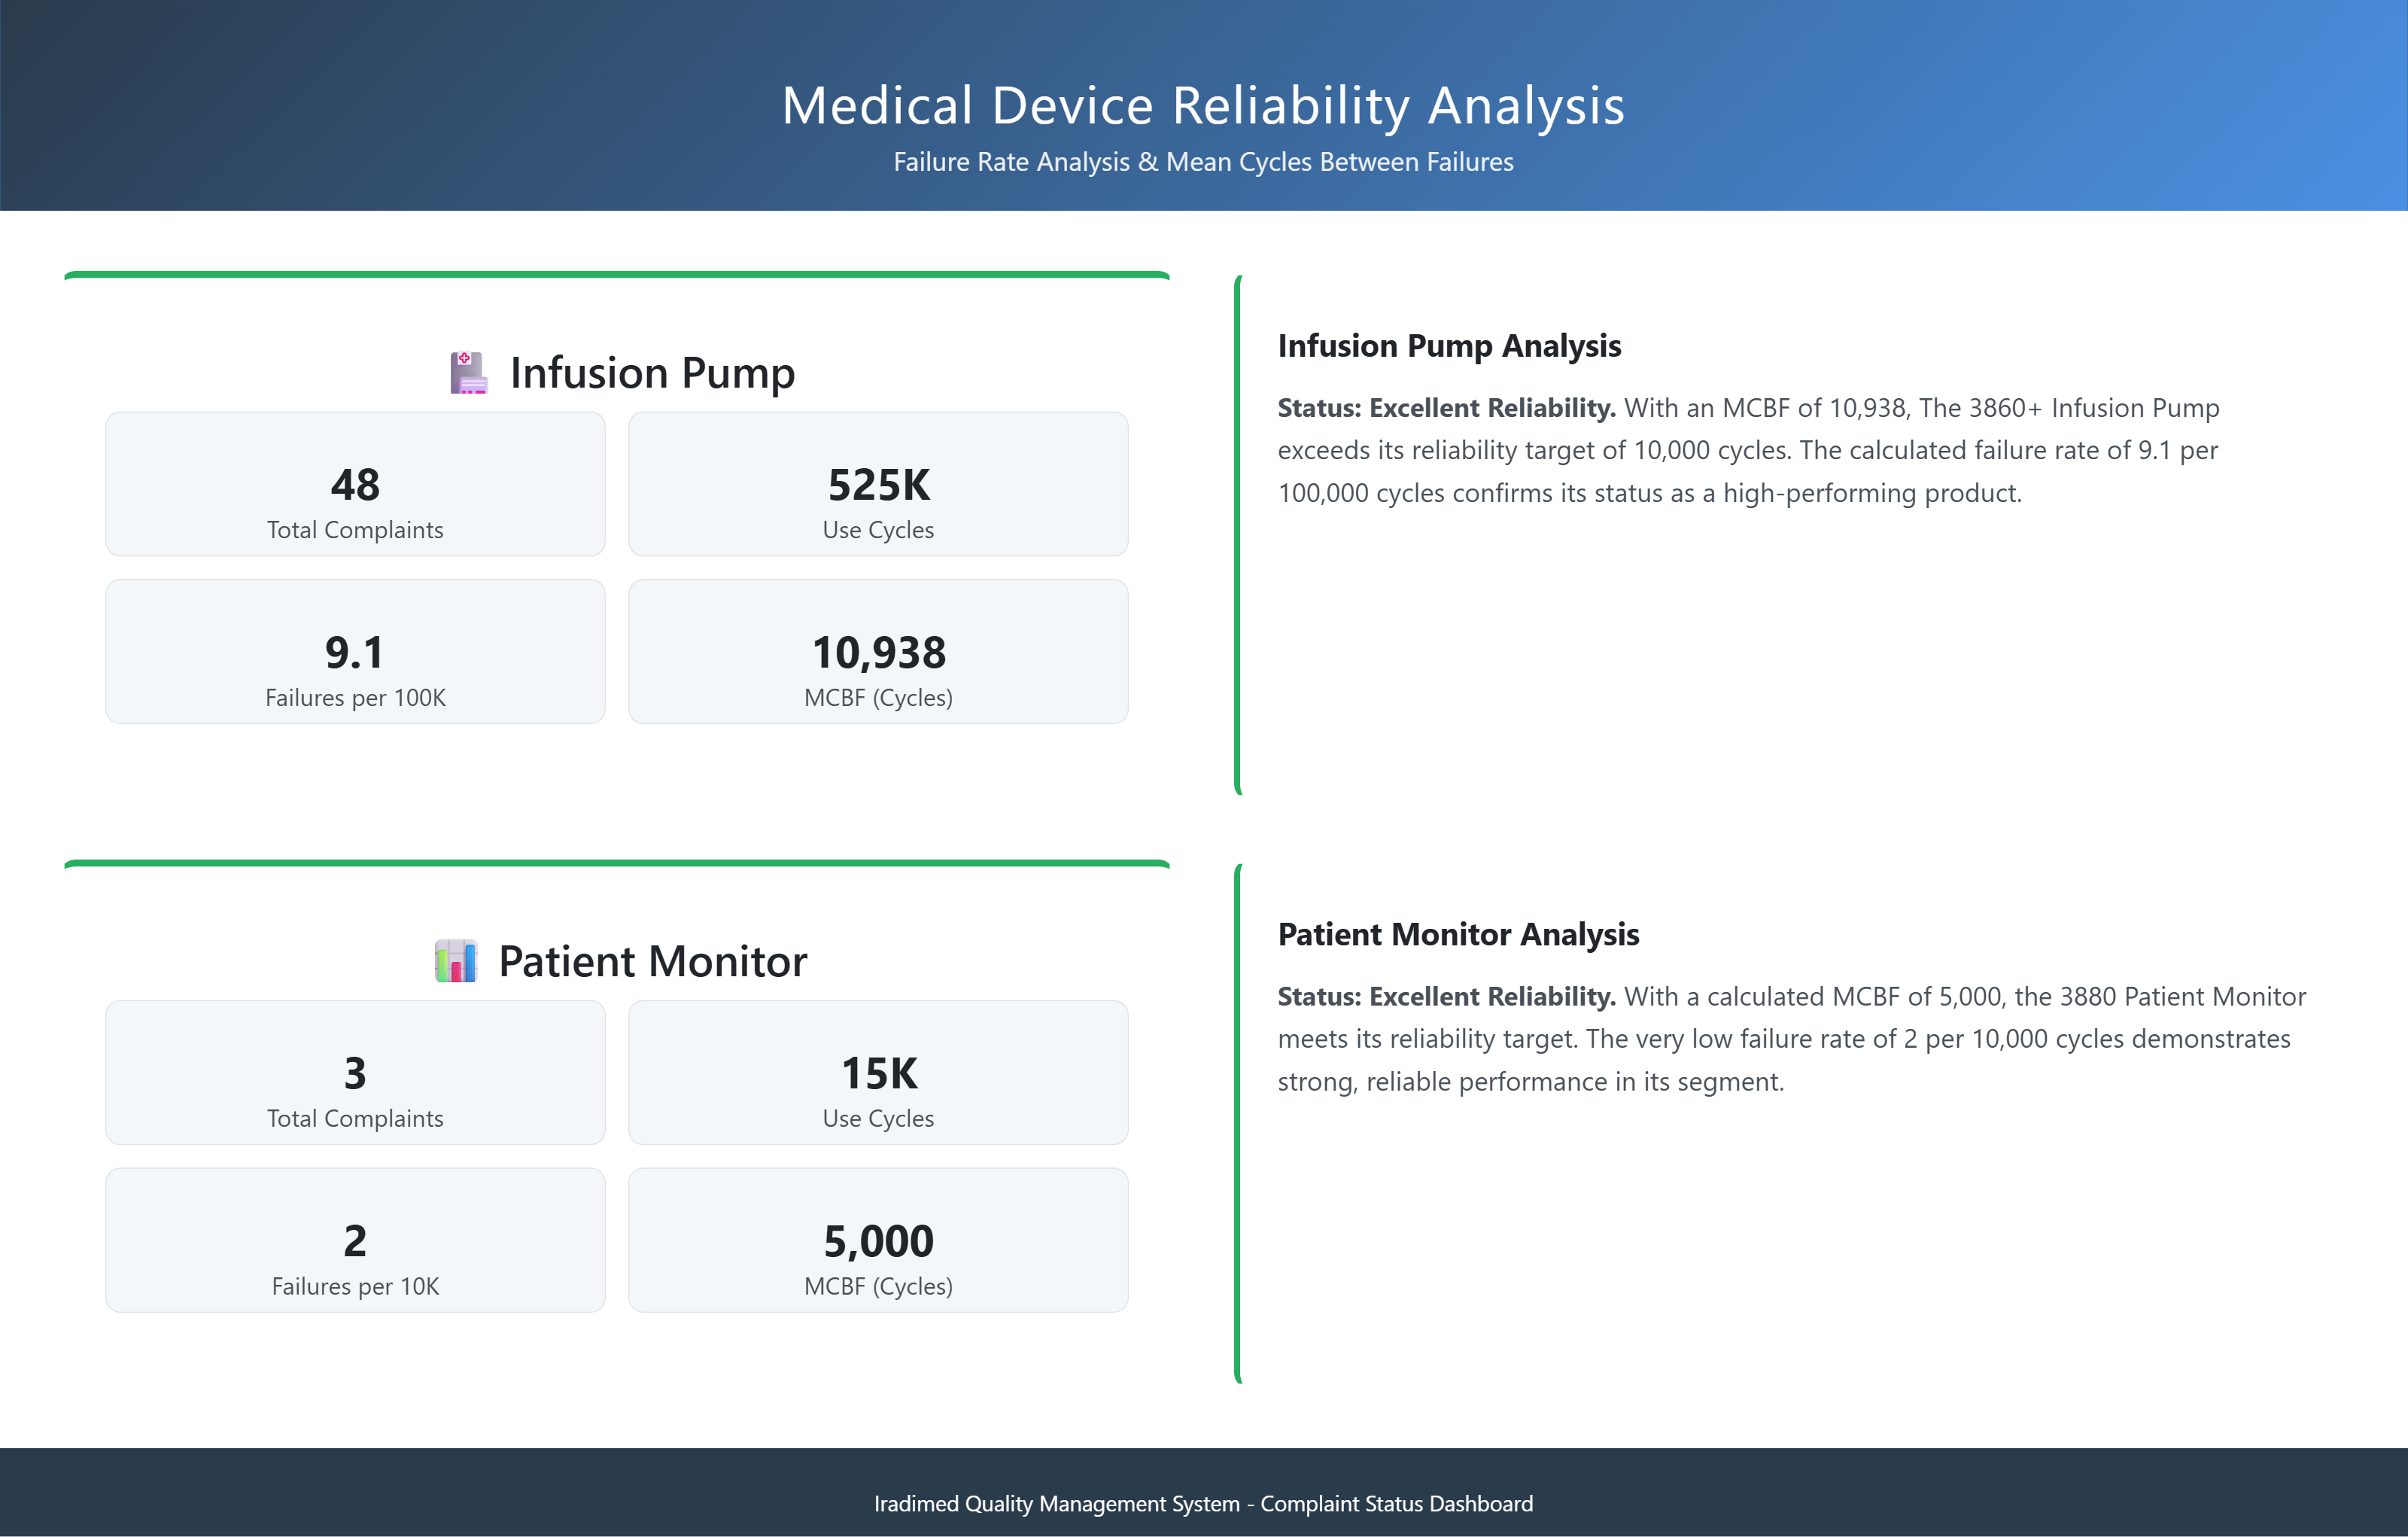
Reliability
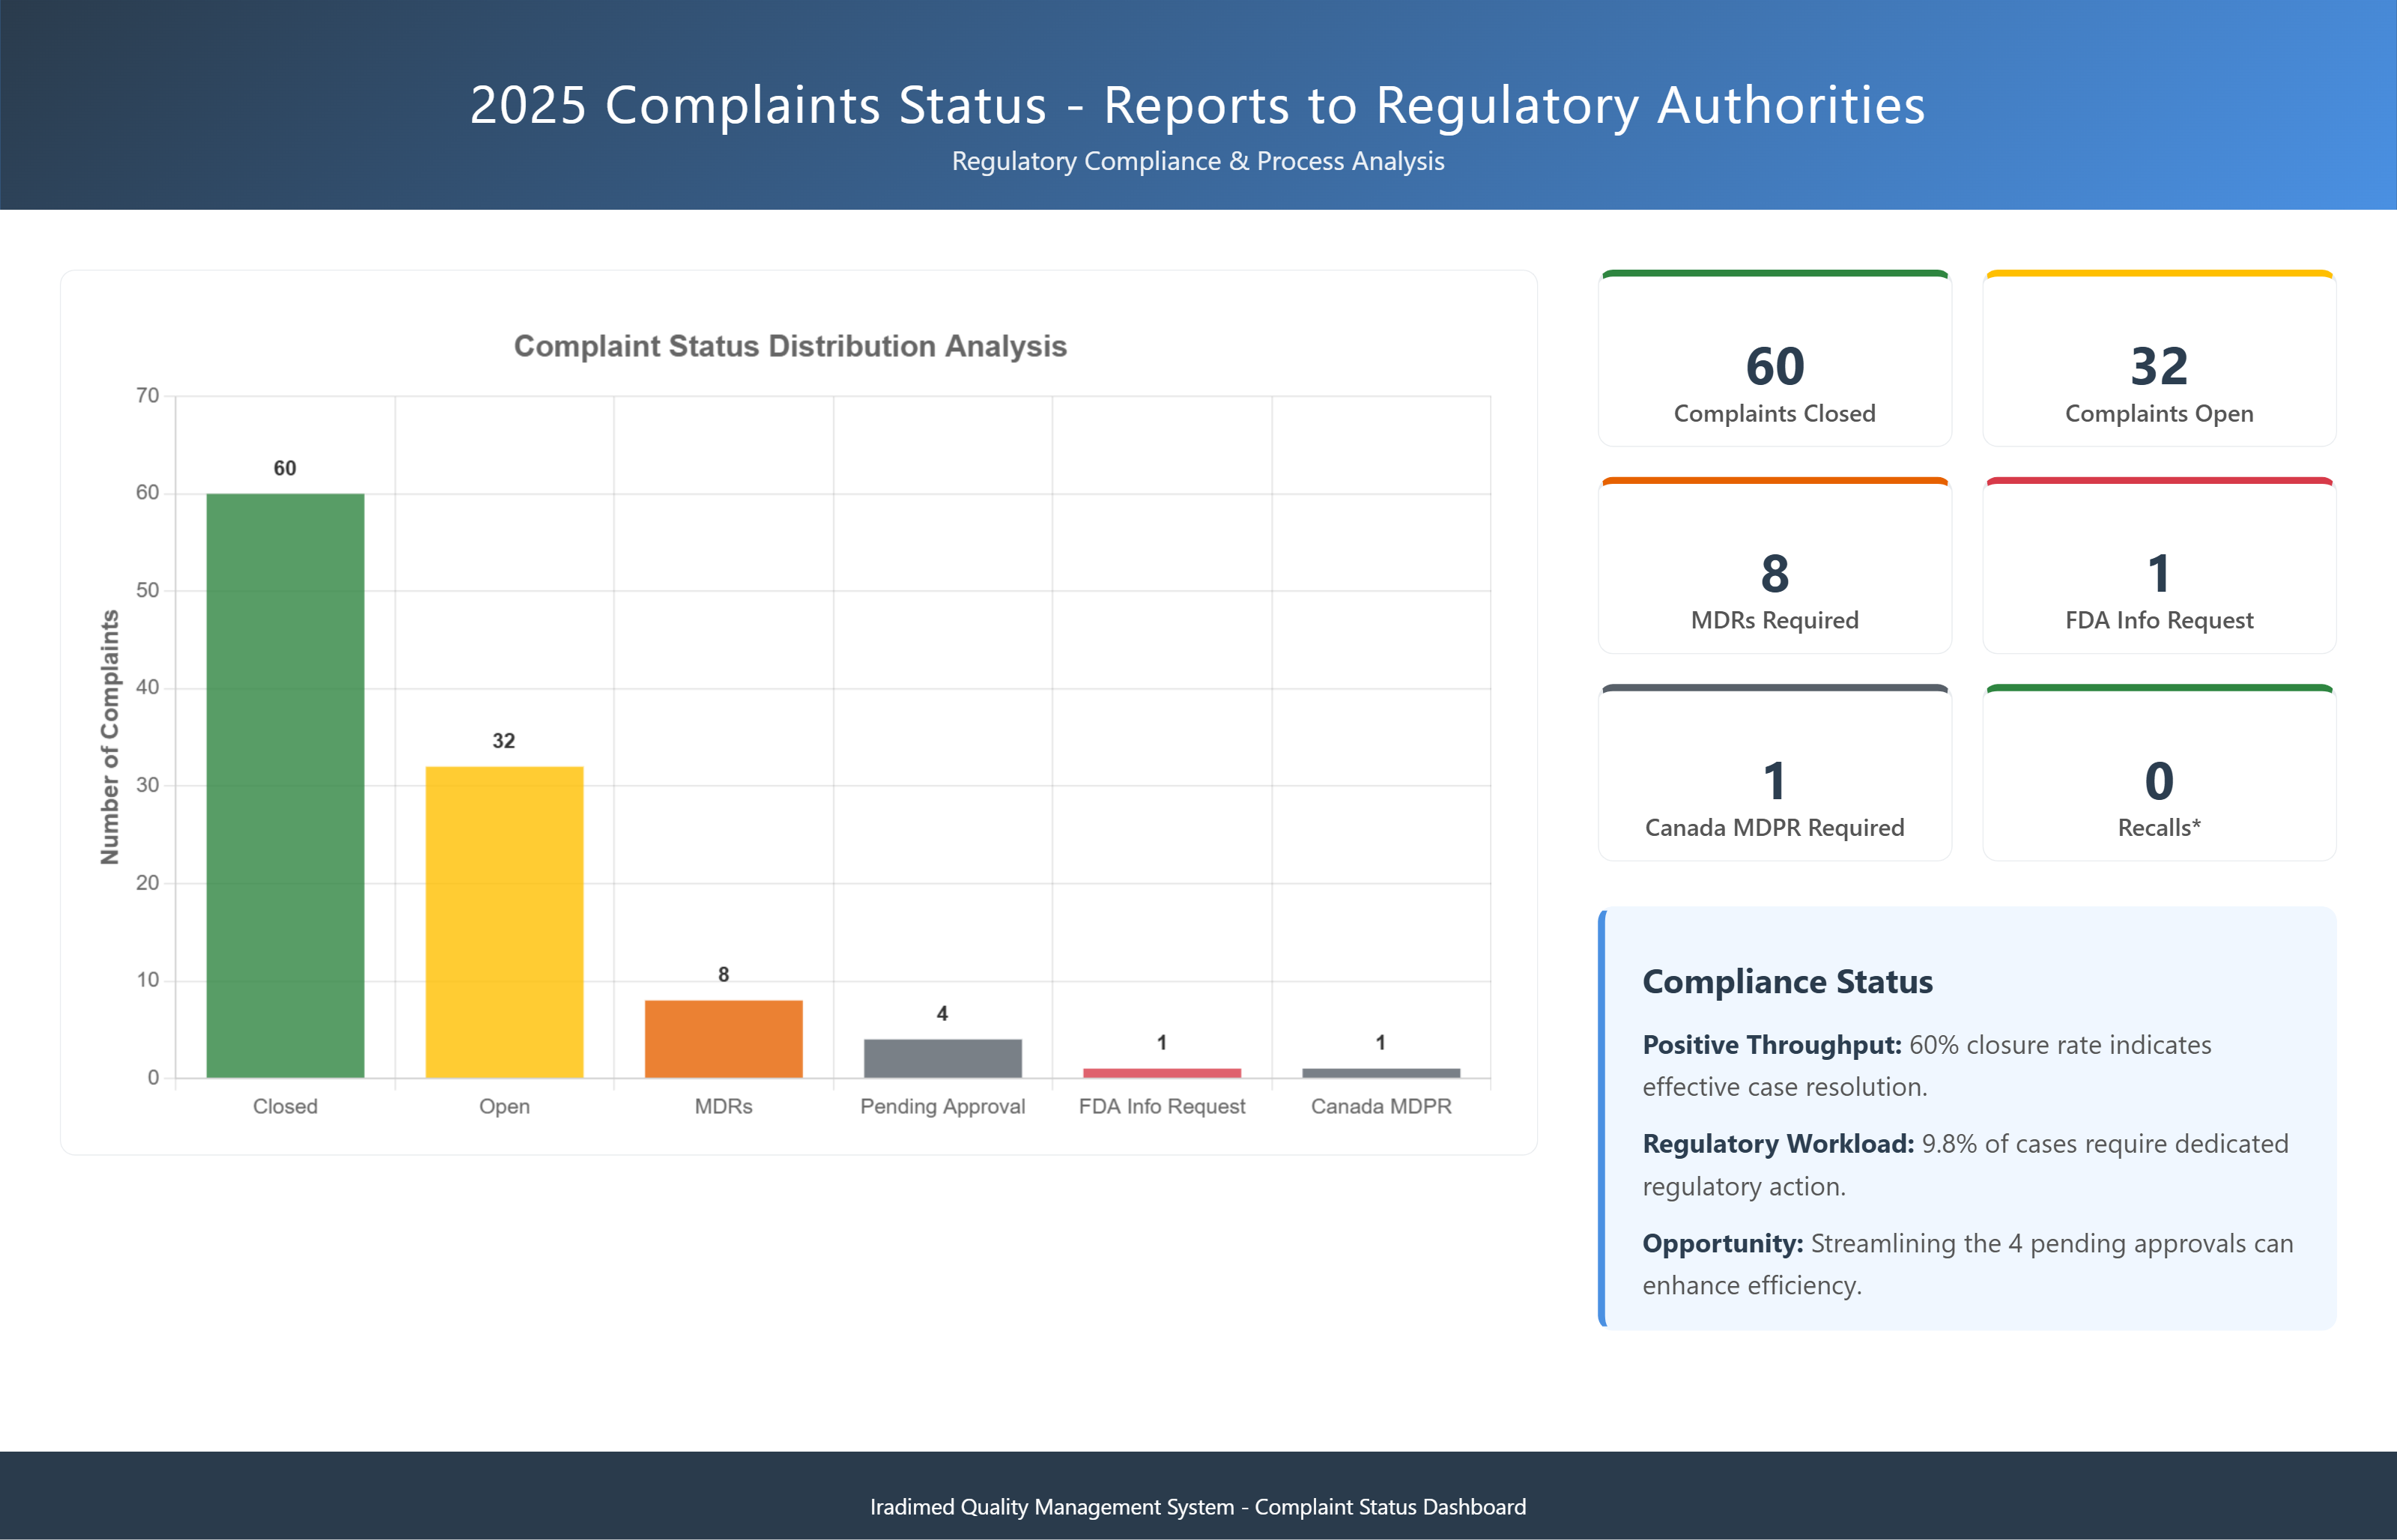
Regulatory Reporting Status
Complaints Over Time
Top Offenders
Customer Training
Mean Time to Closure (Aging)
Service Calls Analysis
Proactive PMS Clinical Follow-Up
Complaints Per Million
Regulatory Reporting Status